Hello! I’m Kenny Chong De Wei, based in Singapore!
A Data Scientist by profession, I’m product-centric.
I share my projects, thoughts and running journey here. Welcome to my personal website!
Data is updated in real time from my Strava account. I then use Strava API to host my own API and use Datawrapper and a Javascript library to create the following graphs. Click here to see the full dashboard!

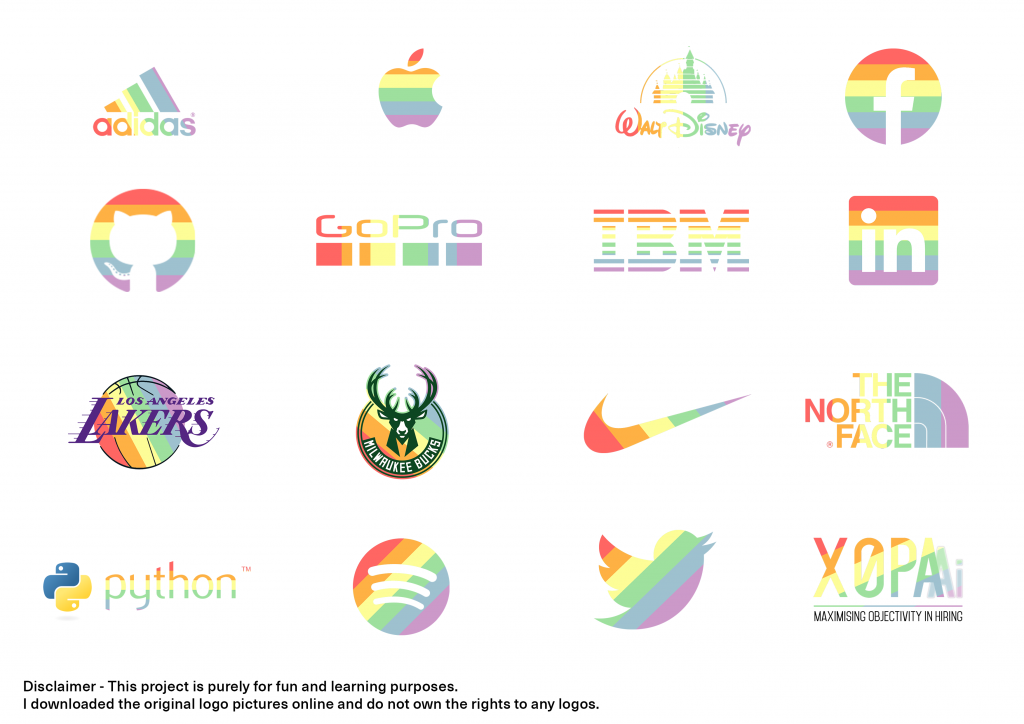
So last year (and every other year during this month), many companies changed their logo into a rainbow-themed logo to celebrate Pride Month. I wanted to know if it can be automated. So I tried it using Python (mainly OpenCV) and got some nice results!
If you would like to try uploading your own logos now, I have deployed the application under a telegram bot. Visit https://t.me/RainbowPrideLogoBot, and follow the instructions there!
The code can be found at https://github.com/kennycdw/rainbow-logos.
Visualizing tree-based models and why they work
I changed hyperparameters in the decision trees and showed visually how they changed in a 2d graph. Neural networks are overrated. In nature we trust,
trust the trees in tabular data.
How to split teams when playing basketball (or any team sports!)
Splitting teams playing “black or white” is inefficient.
We use some mathematics and the Monte Carlo method (simulations) to prove that playing scissors-paper-stone splits a team into two much faster.
Playing cards and probability
A Full House is stronger than a Flush and a Flush is stronger than a Straight. Are the odds of getting straight in a 13 card hand (like dai di) the highest out of the three though?
Head over to
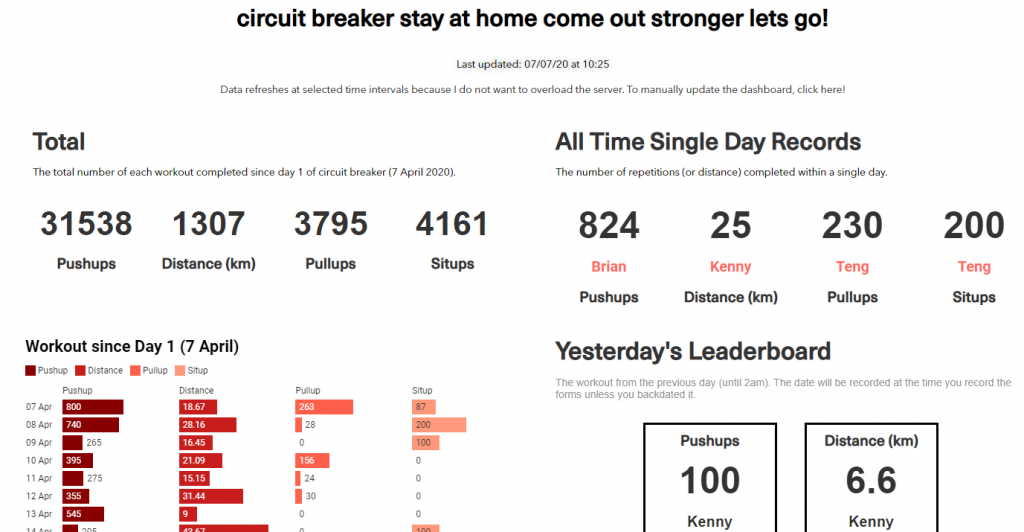
https://kennyvectors.com/stay-at-home-exercise
Users submit their daily data through Google Forms, which is then transferred to Google Sheets. I then write a simple script to process the data using pandas and host the JSON file (https://workout.kennyvectors.com/jsonexport) with a Flask API!
The UI is then designed using Elementor from WordPress and a simple Javascript is written to change various HTML text from the JSON file.
The graphs are created with Datawrapper, I highly recommend using them as a data viz tool!
